


 5 / 20

 www.ohca.com
Oregon Health Care Association
5
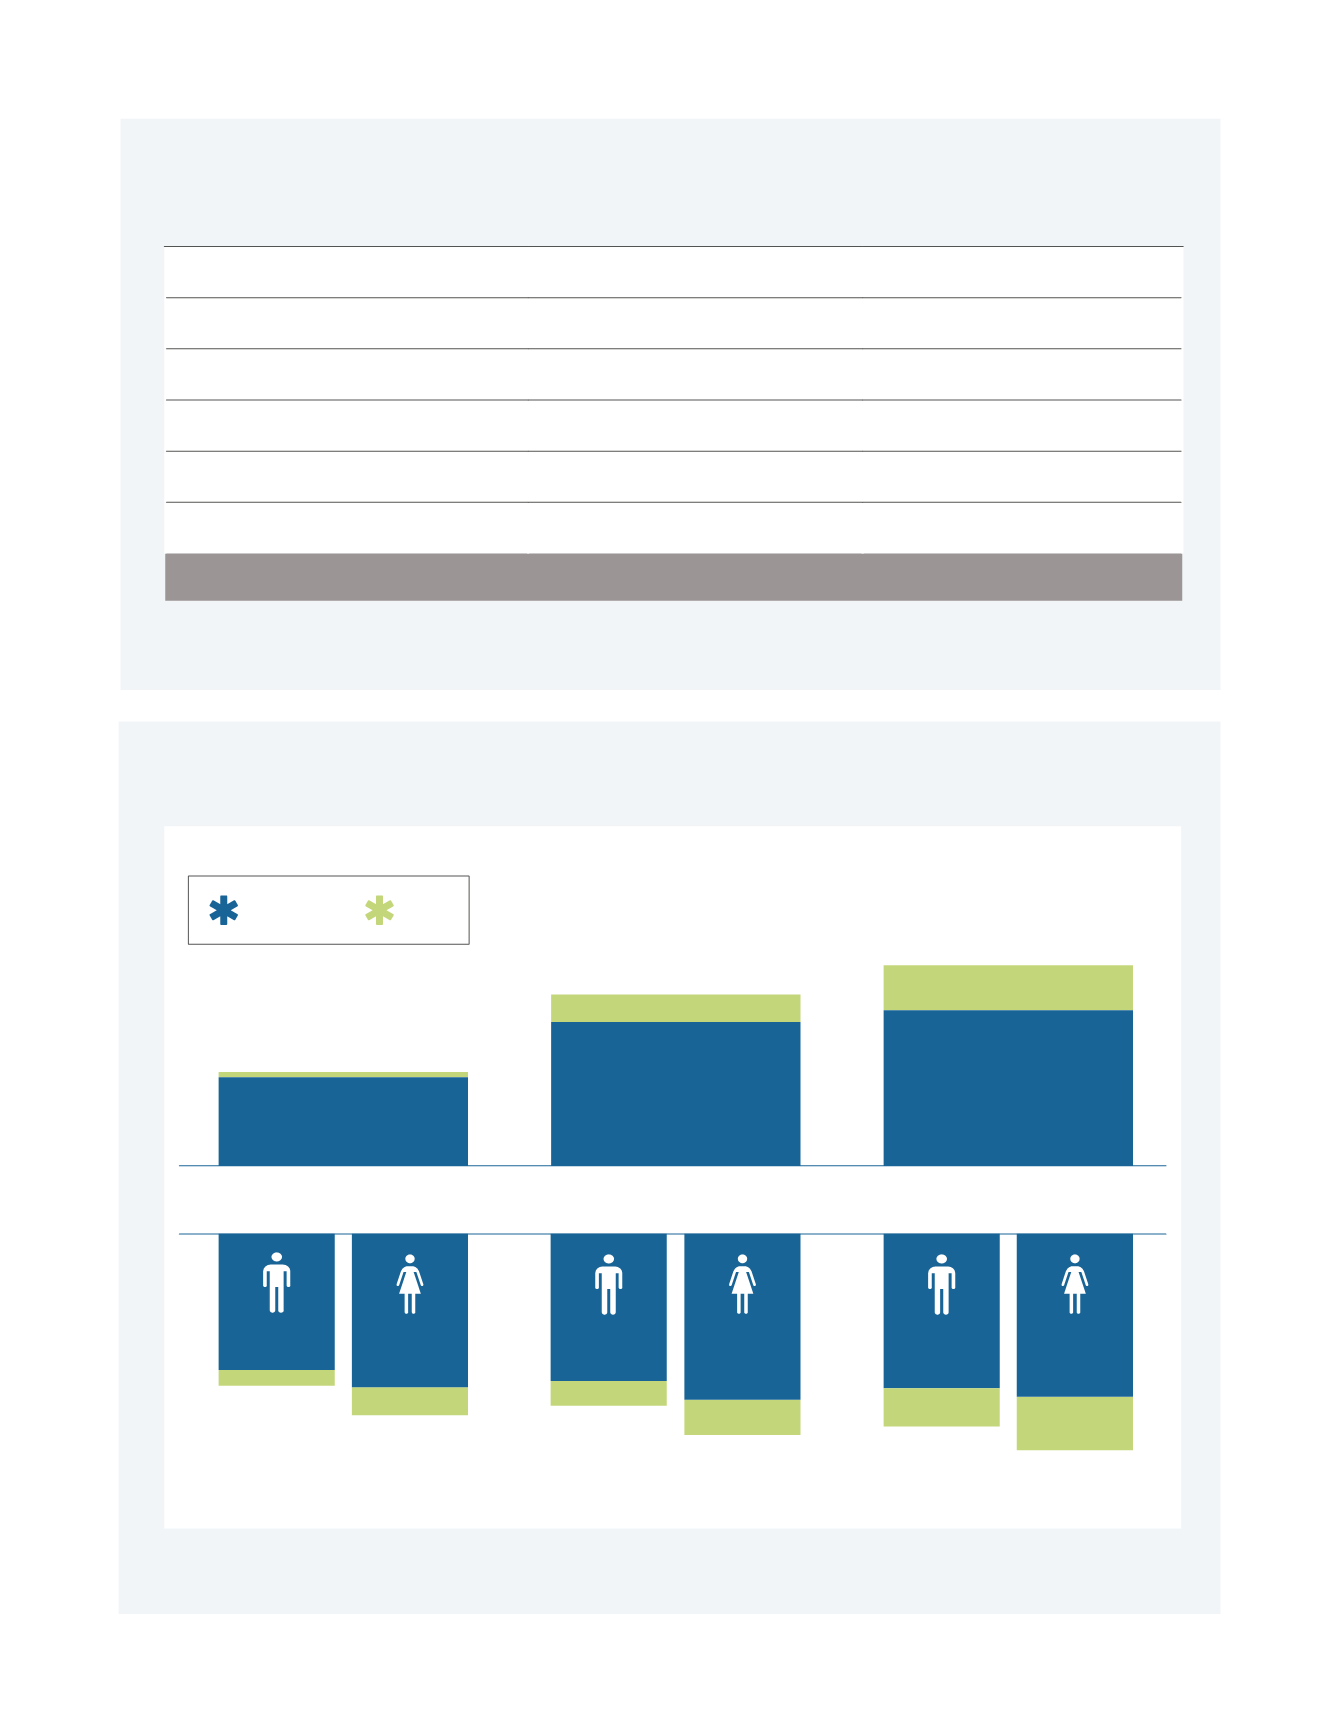
Forecasts of Oregon’s Populations by Age and Gender, 2015–2050
Source: Data from “Forecasts of Oregon’s County Populations by Age and Sex, 2010–2050.” Office of Economic Analysis, Department of Administrative Services,
State of Oregon.
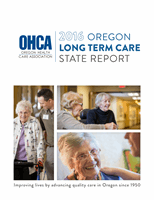
PROVIDER TYPES
NUMBER OF SERVICE PROVIDERS
PEOPLE SERVED EACH DAY
In-Home Care
149
30,000+
Assisted Living
221
14,738
Residential Care
119
4,951
Memory Care
167
6,028
Adult Foster Homes
1,692
7,475
Skilled Nursing/Post Acute Rehab
137
7,481
TOTAL
2,335
70,000
Options for Long Term Care—Where People are Served
Sources: Oregon DHS Office of Licensing and Regulatory Oversight, Providers by Setting, April 2016; P Carder et al. (2016)
Oregon Community-Based Care Resident
and Community Characteristics Report: Adult Foster Homes.
Portland State University. June 2016.
65–84
85+
POPLUATION BY AGE
POPLUATION BY GENDER
84,668
560,364
2015
30,450
263,727
54,217
296,637
2035
909,148
173,634
71,706
427,355
101,928
481,793
2050
984,243
283,195
118,277
477,405
164,918
506,838